Charts by TradingView
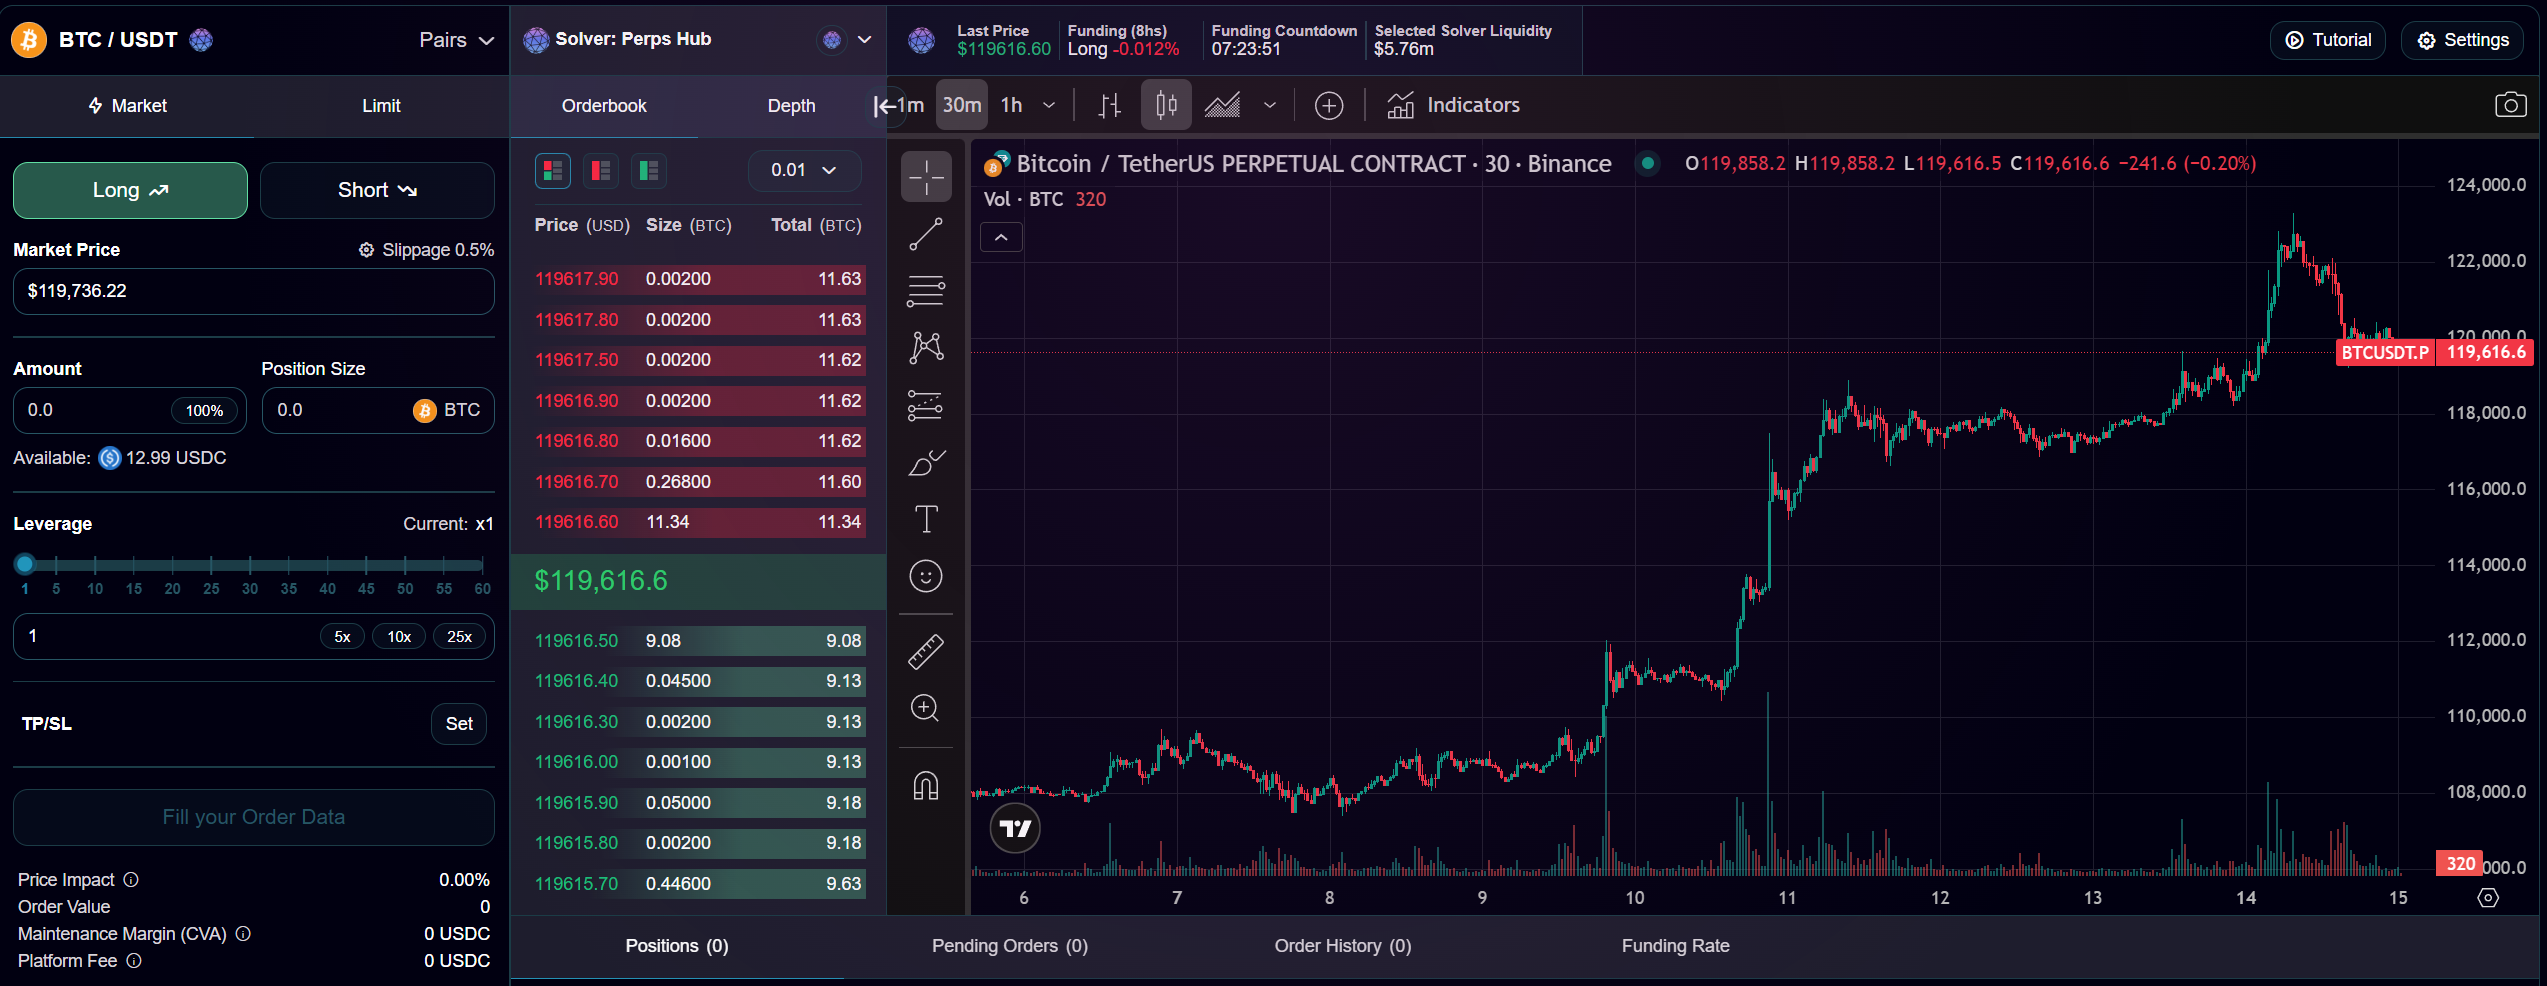
Spooky Perps uses TradingView for charting. Here’s a quick guide to common actions.
Time Frames
Select a time frame from the top-left of the chart.
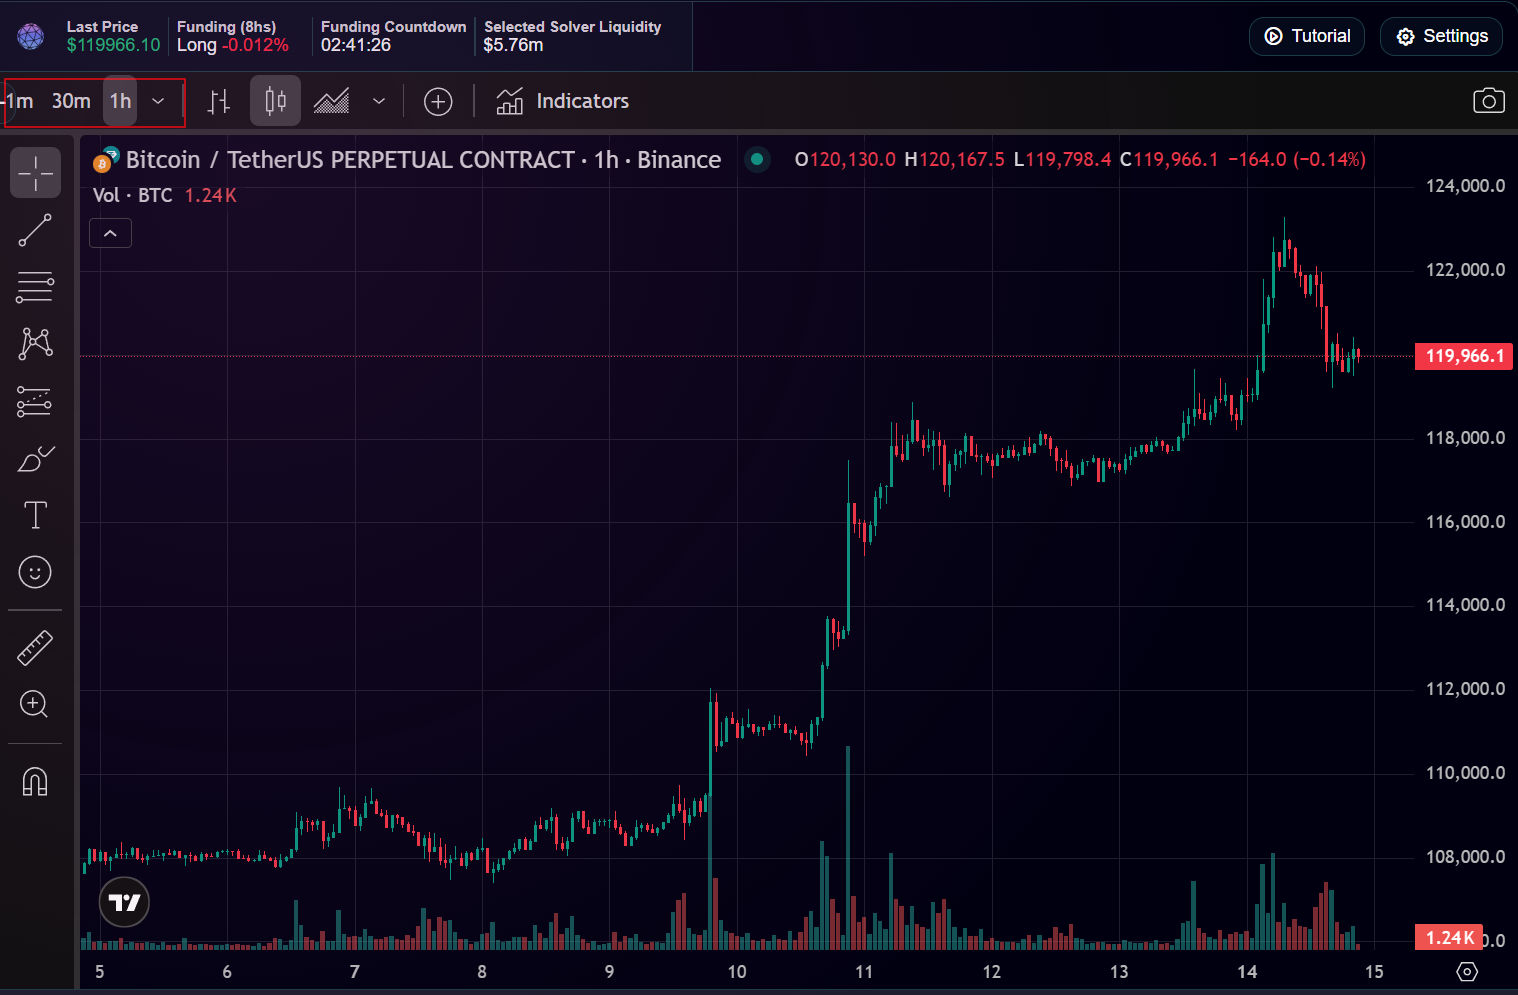
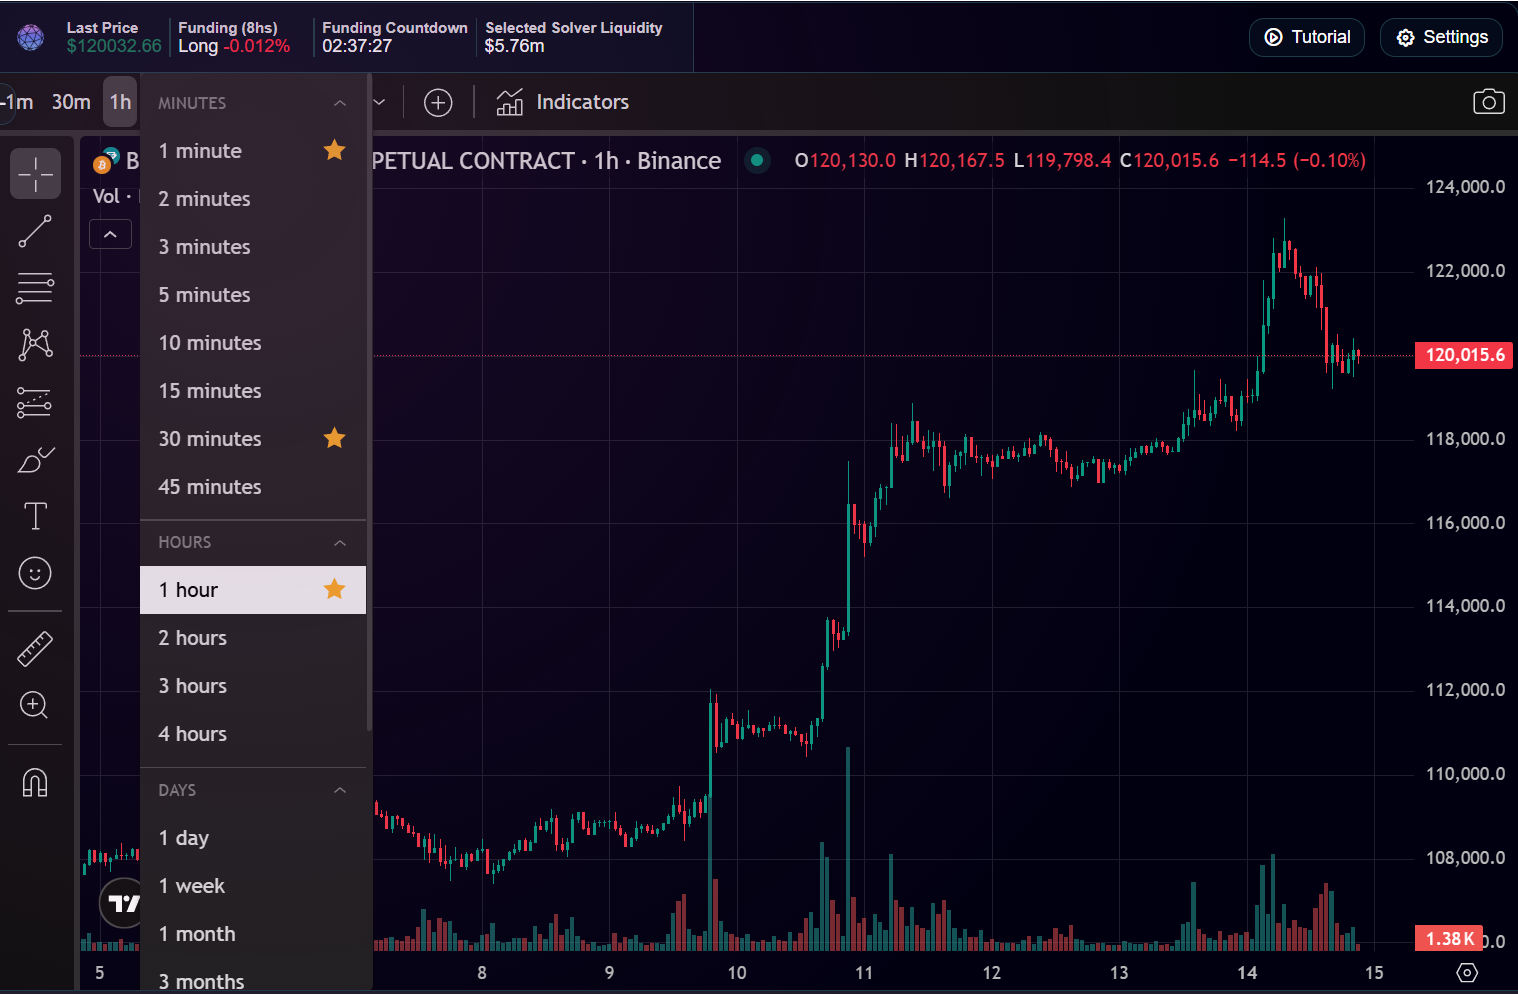
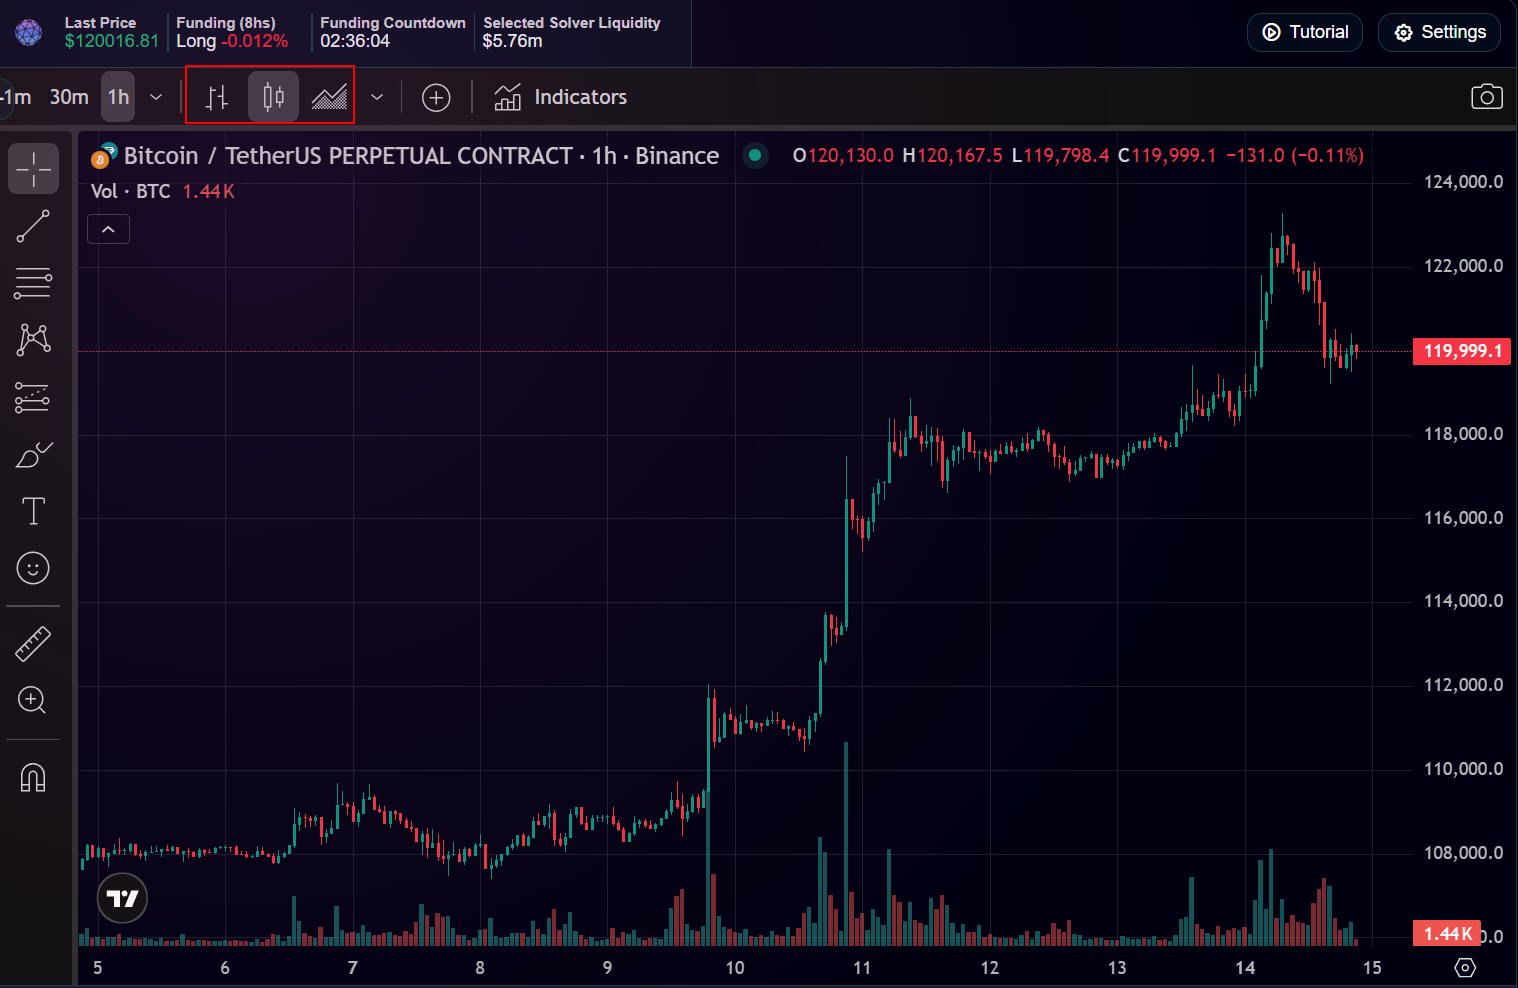
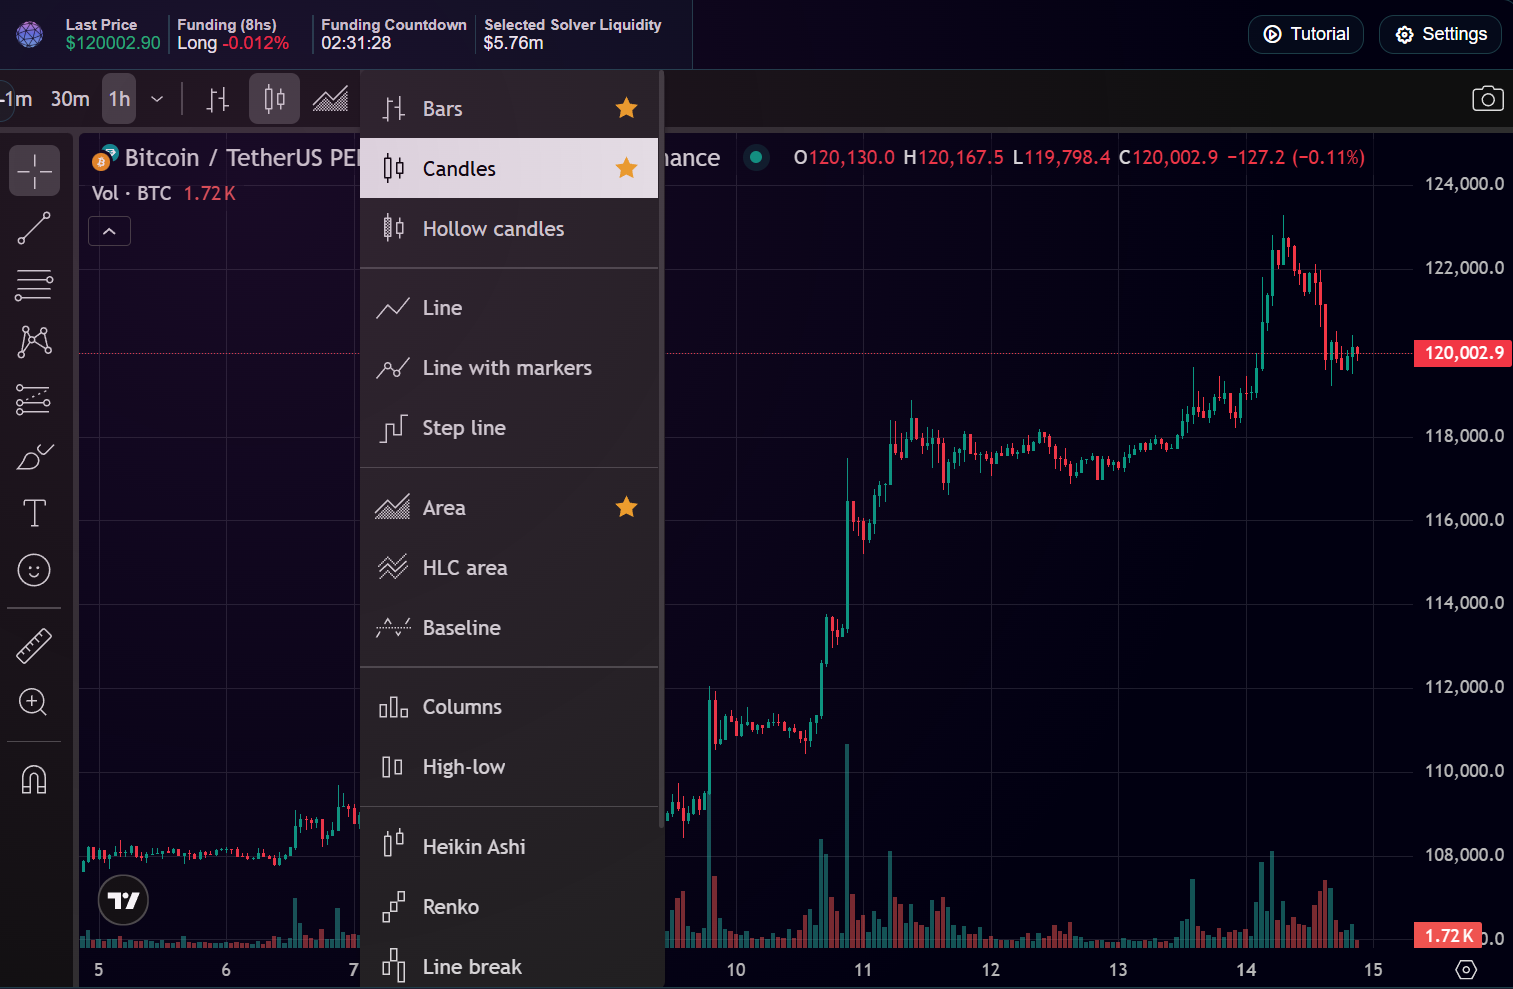
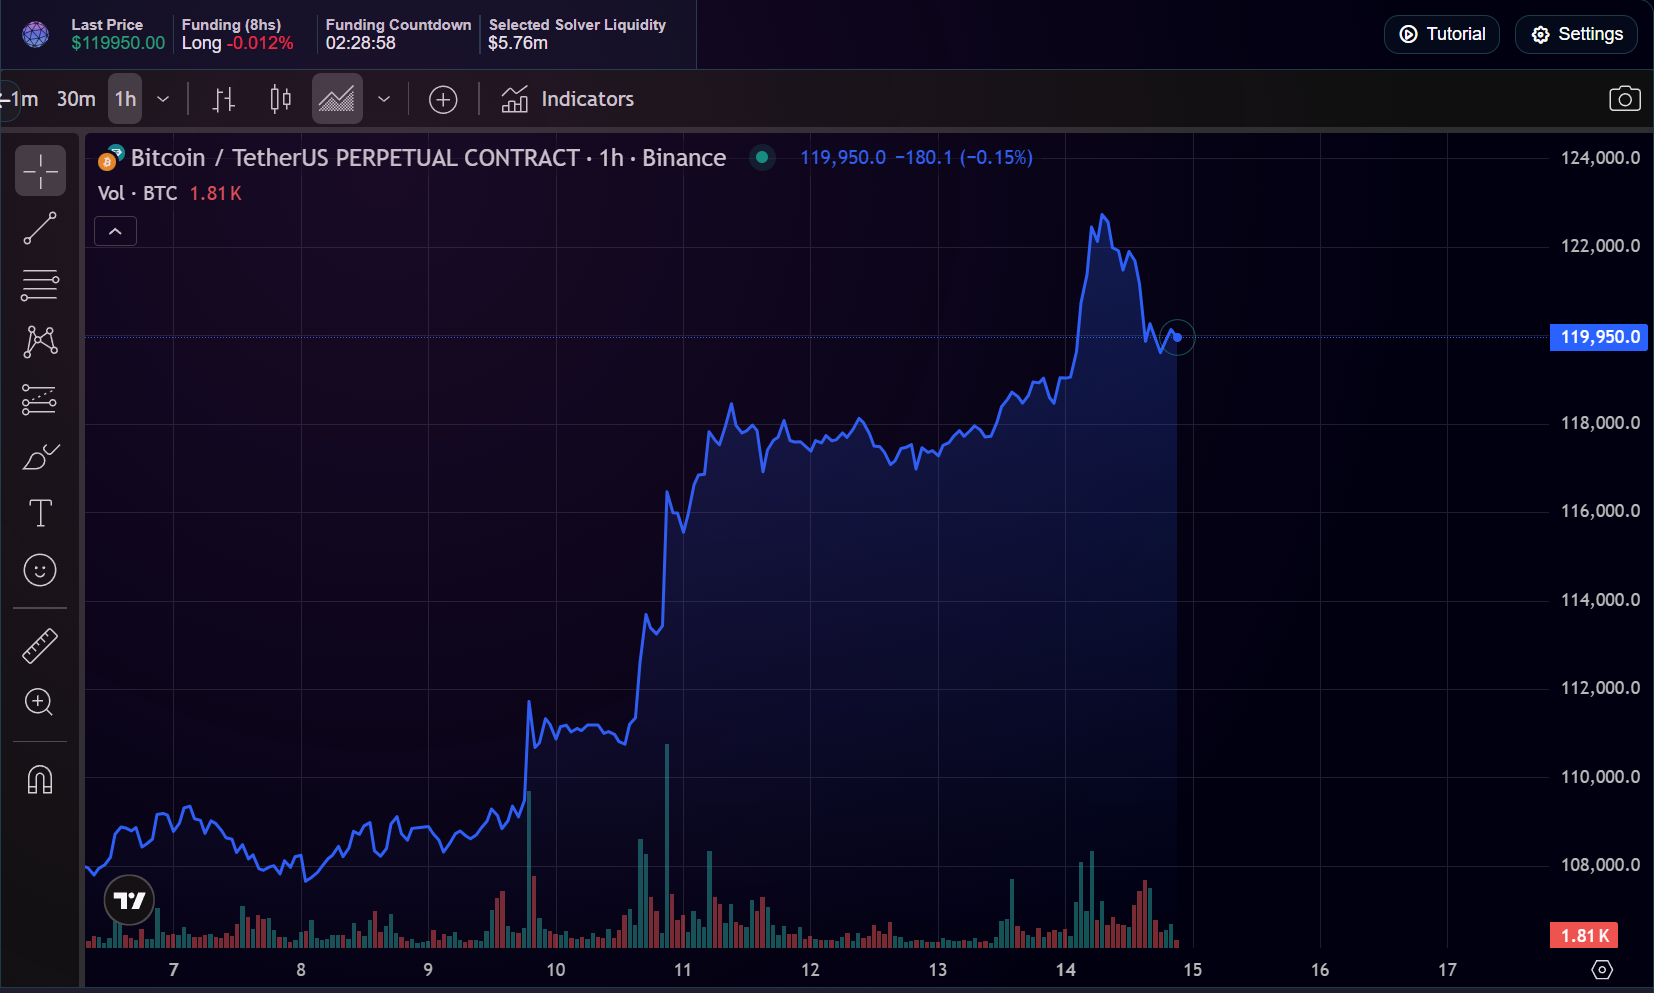
Chart Types
Choose between line, bars, candlesticks, etc.
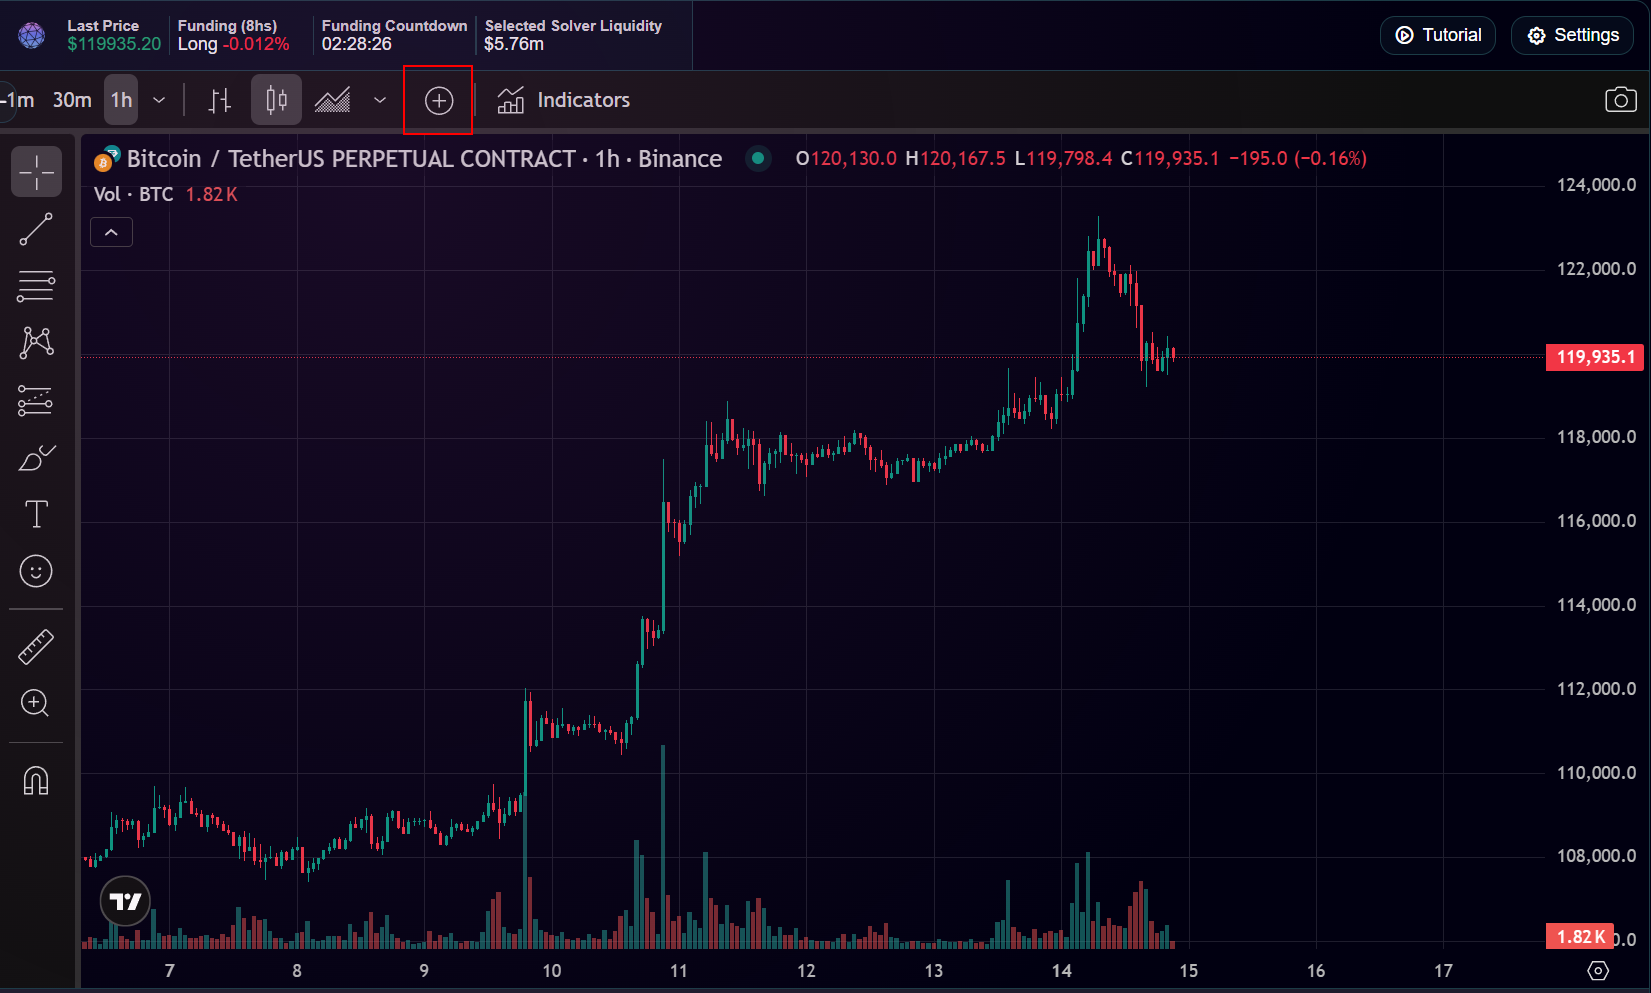
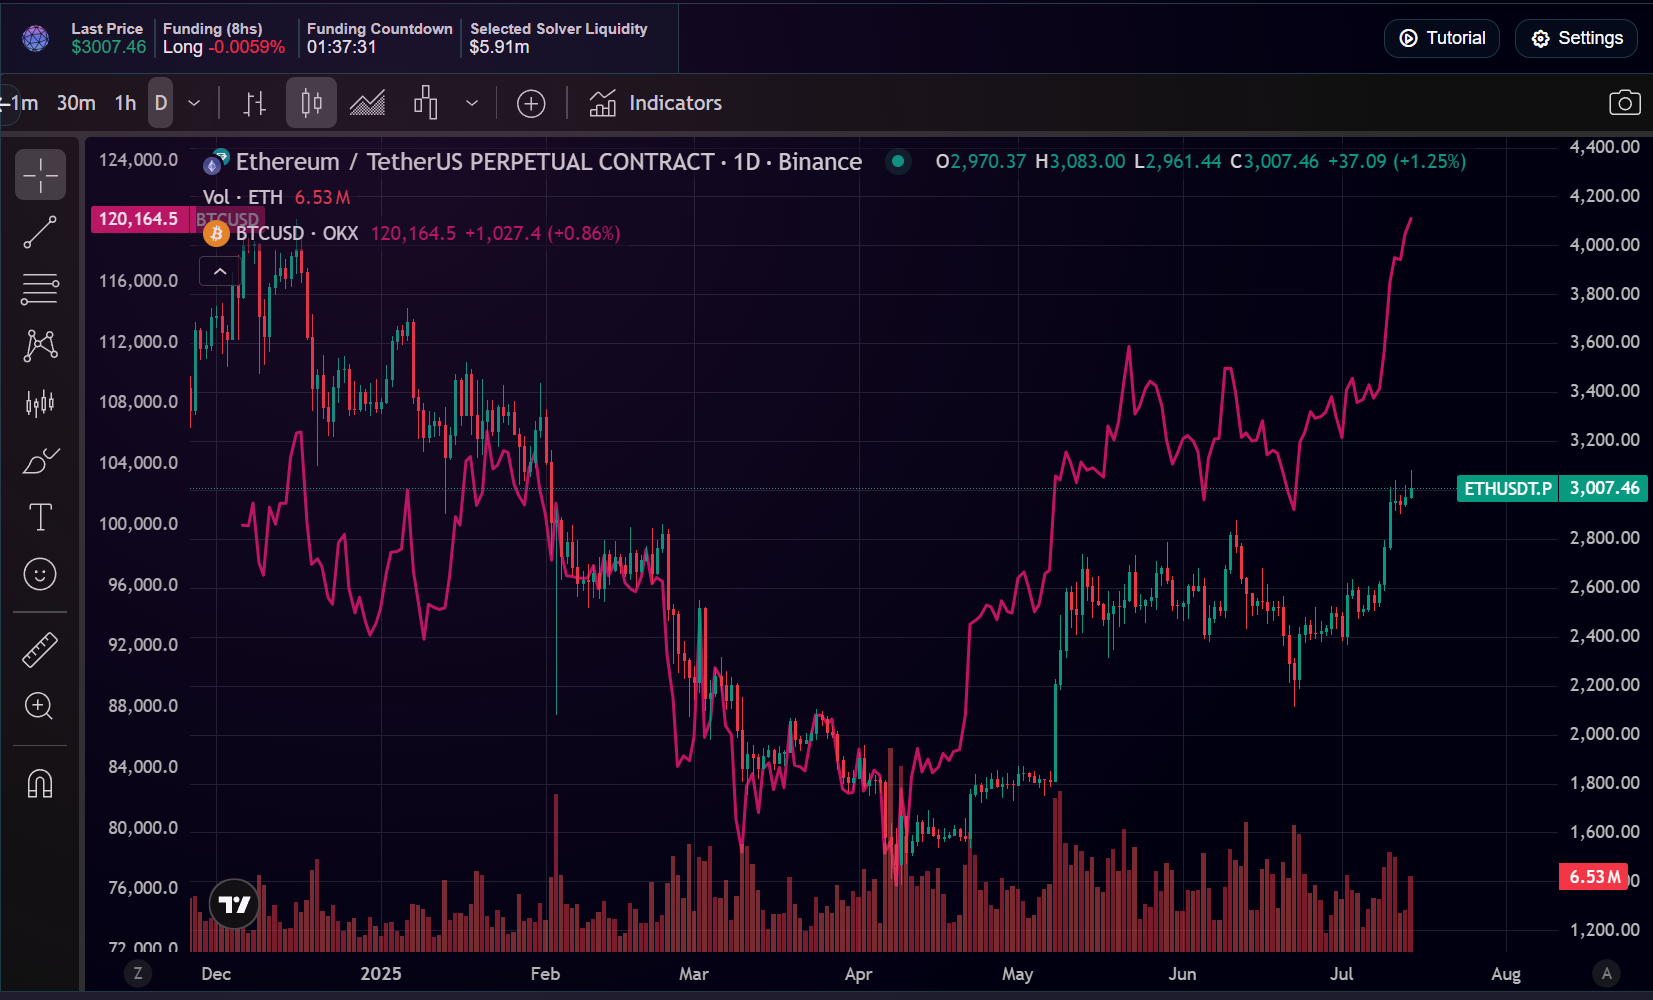
Asset Comparison
Compare multiple symbols on one chart.
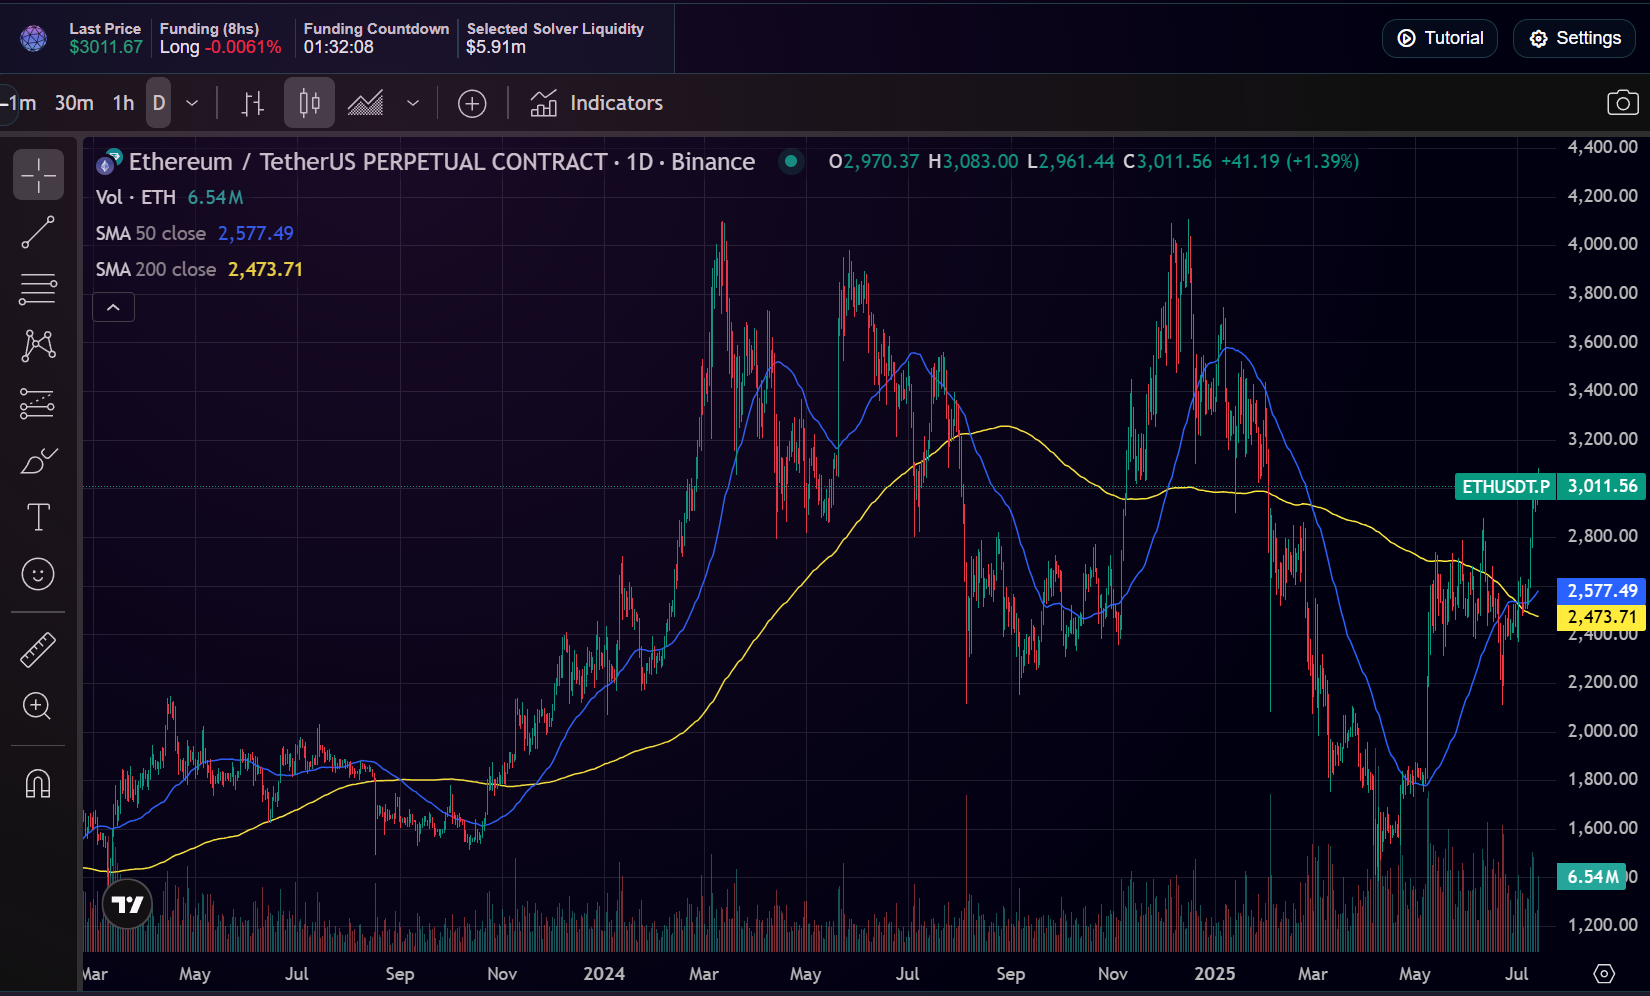
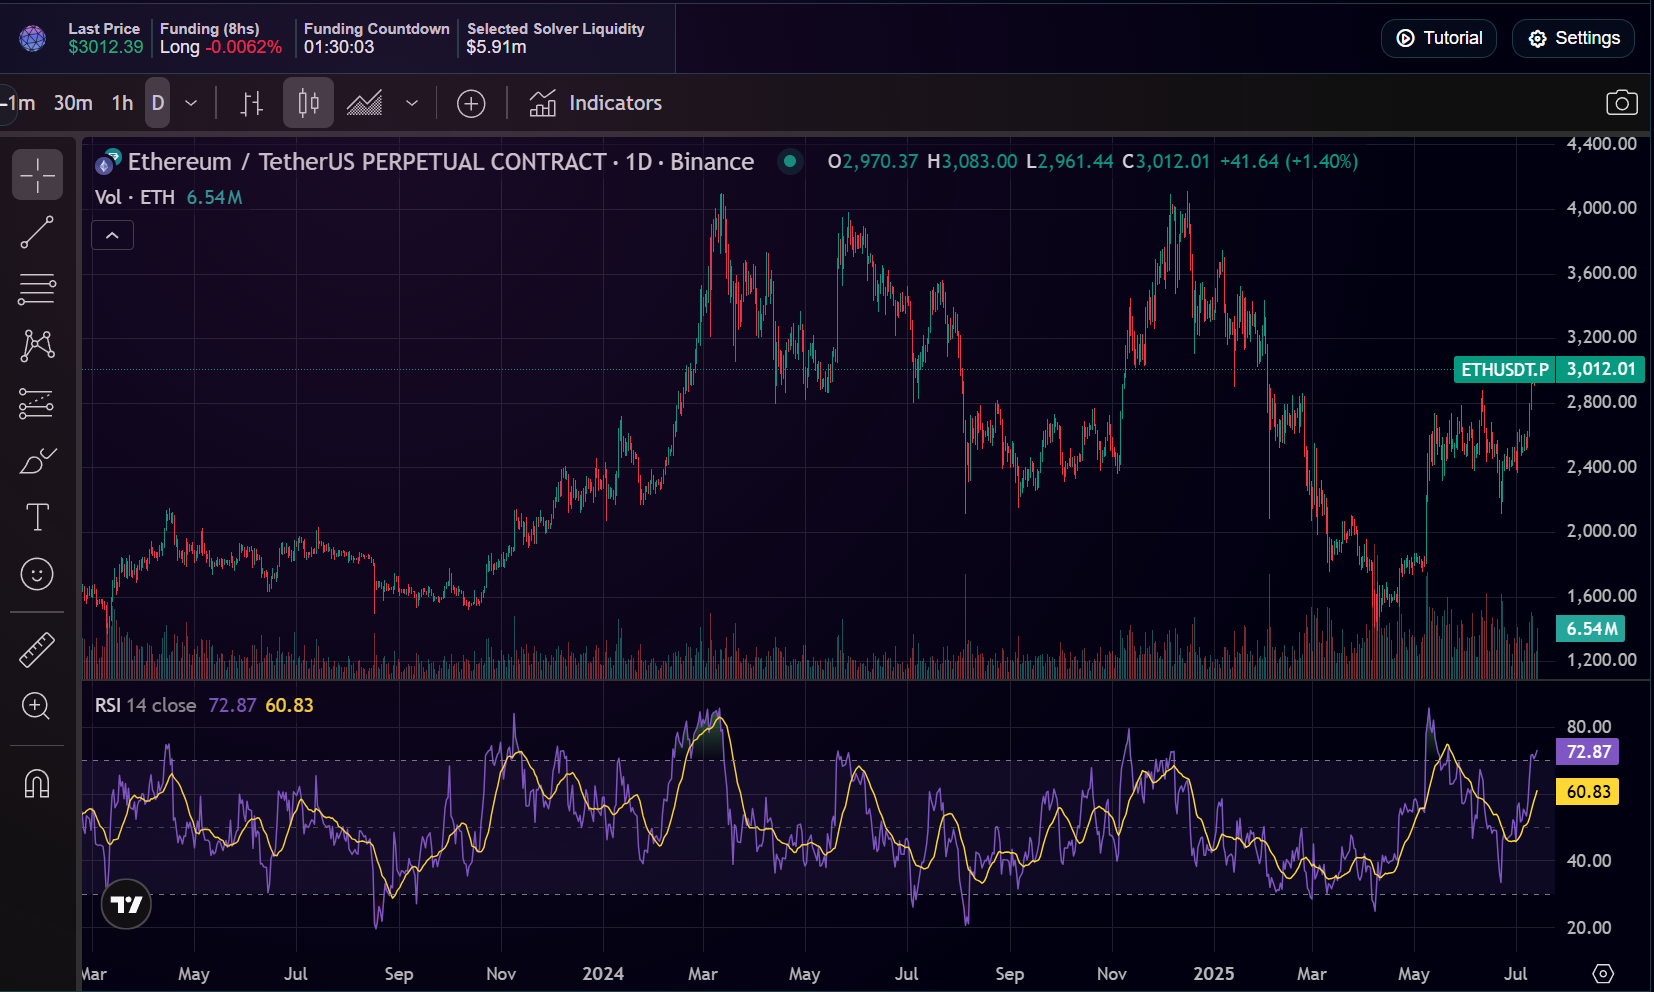
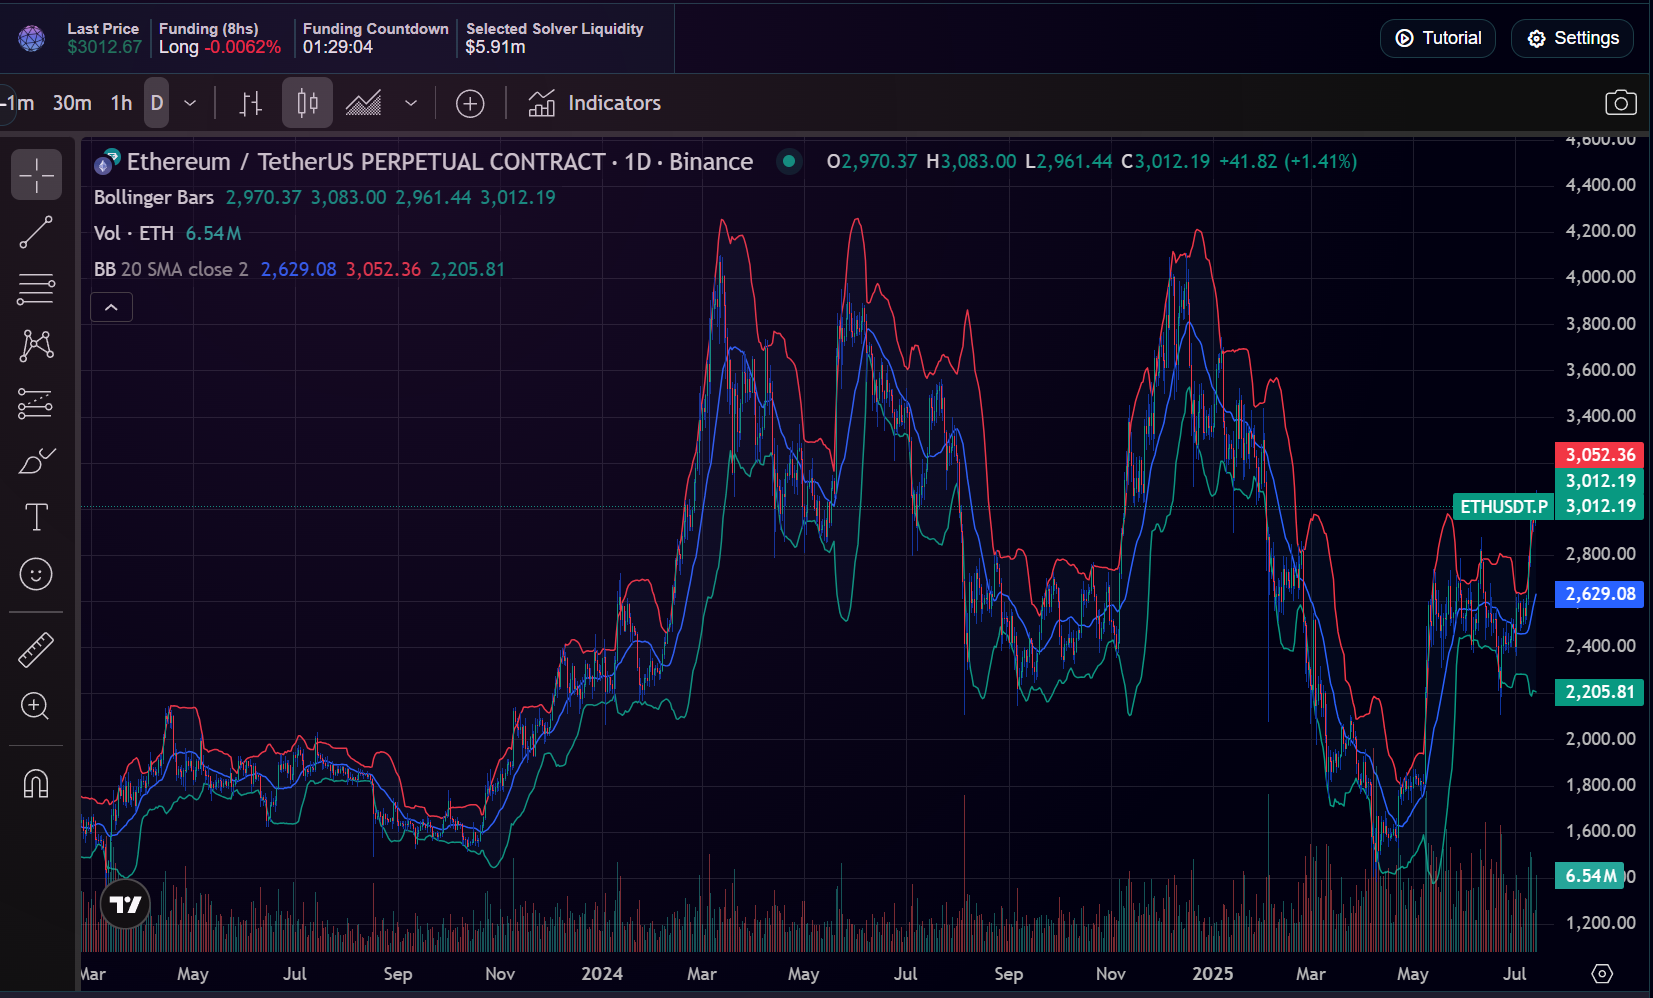
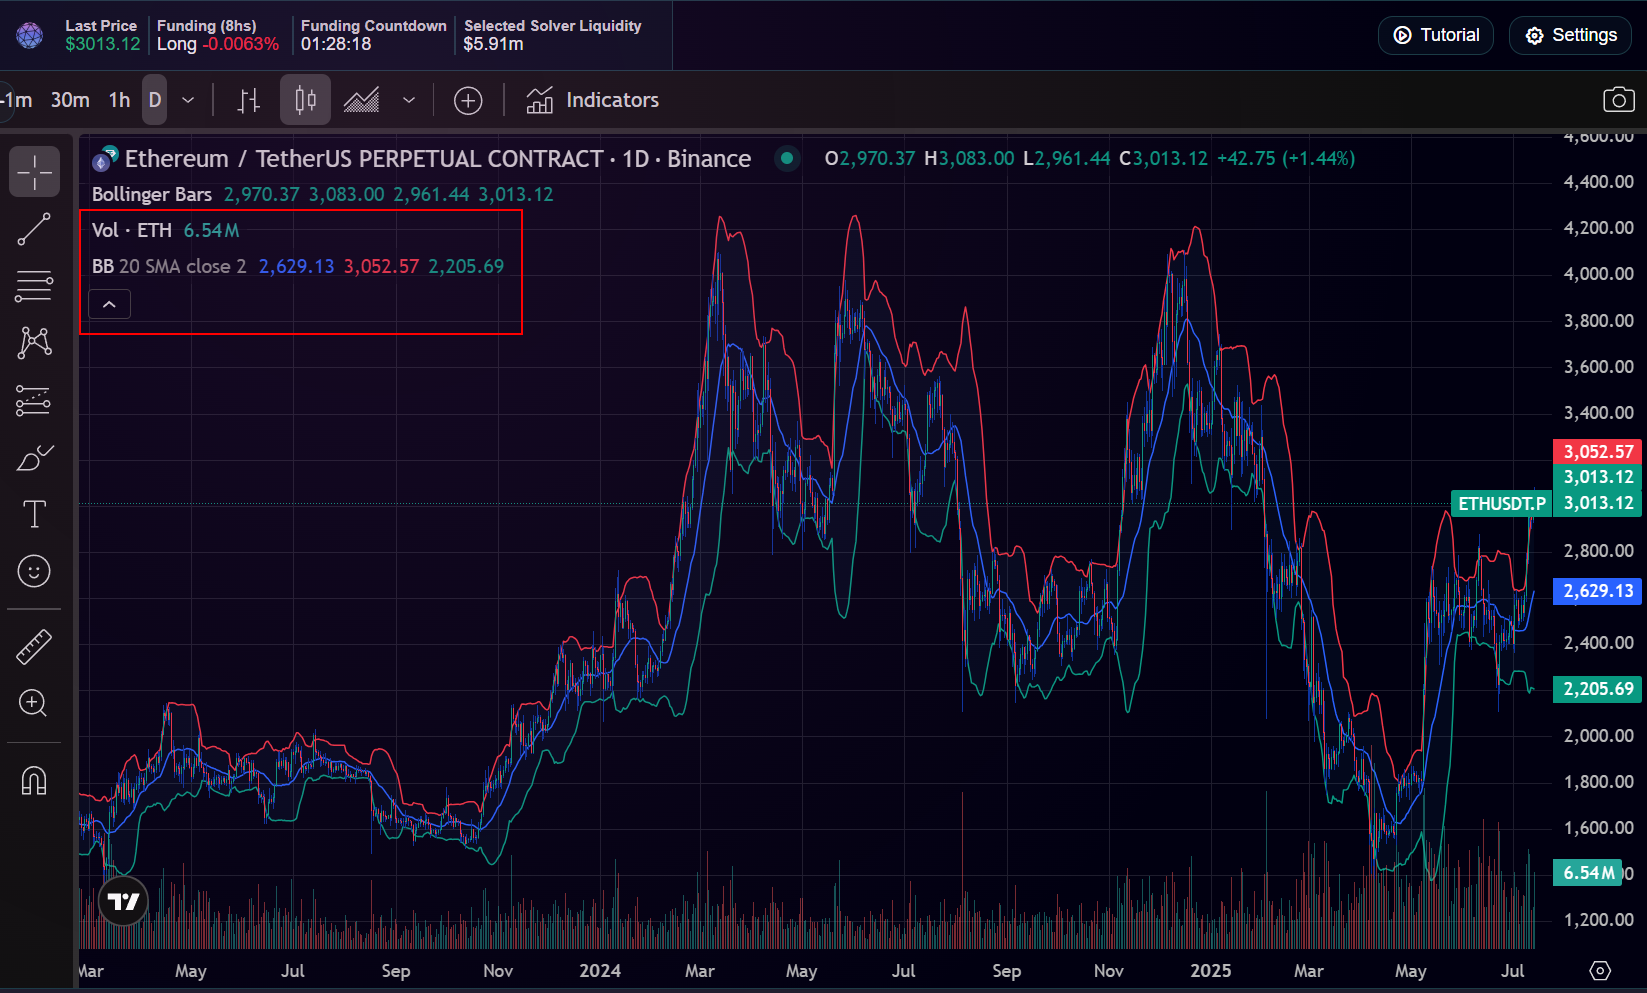
Indicators
Common indicators include Moving Averages, RSI, and Bollinger Bands.
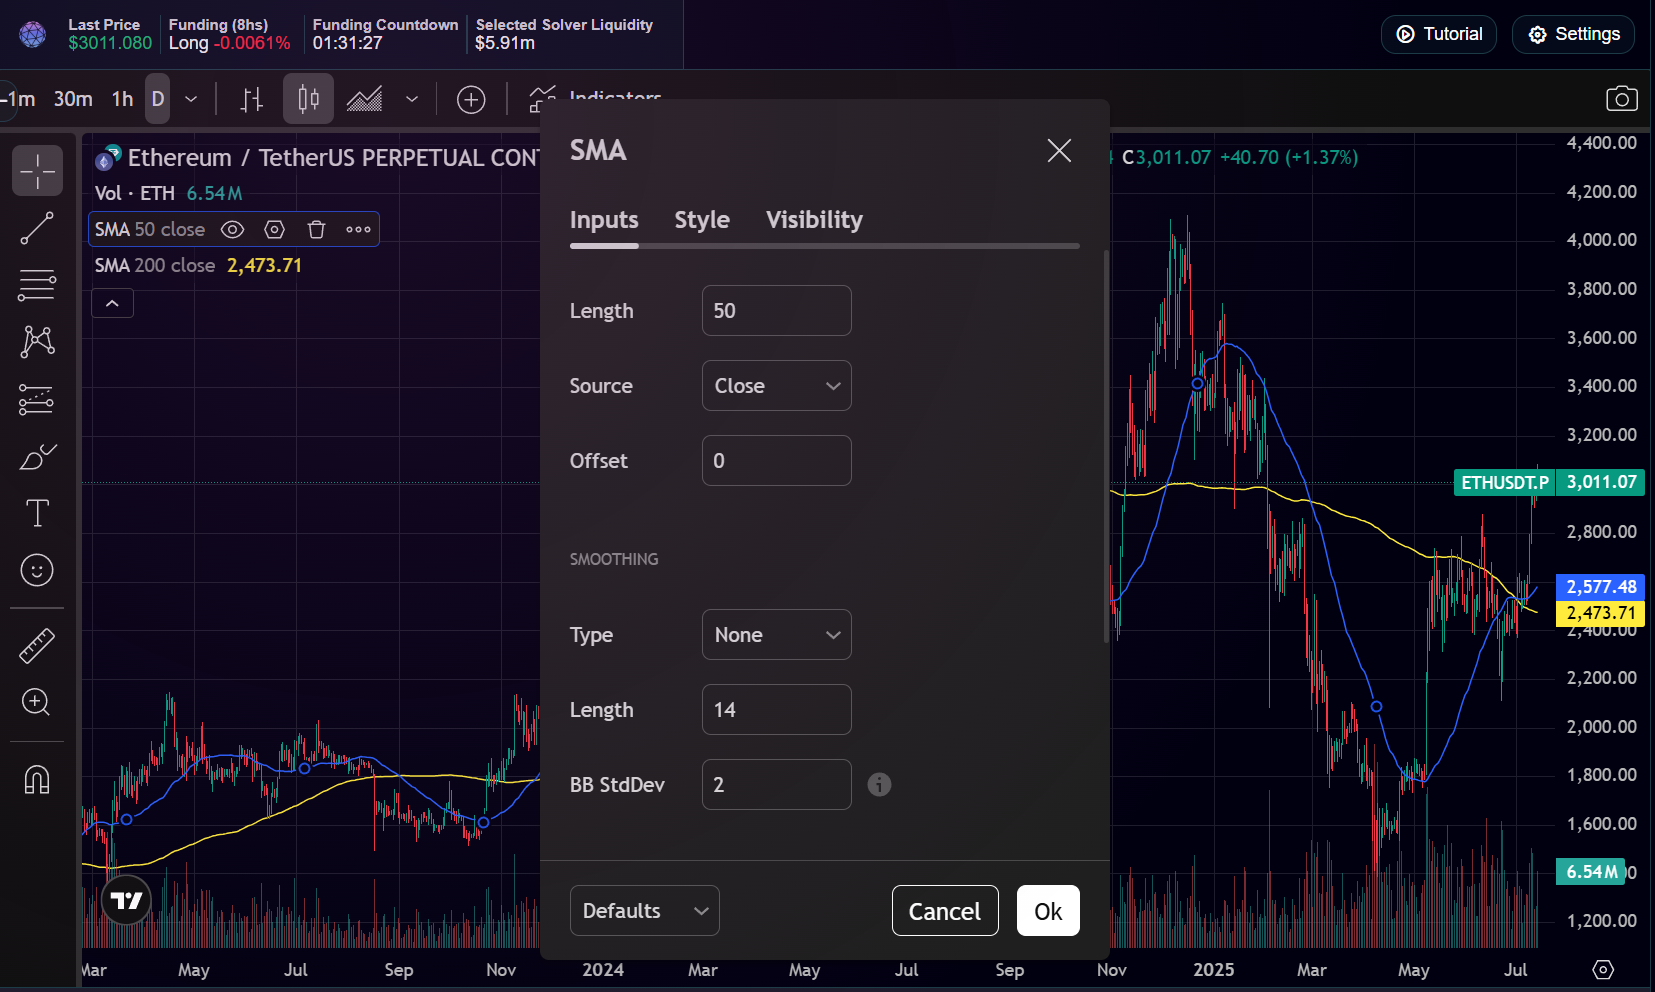
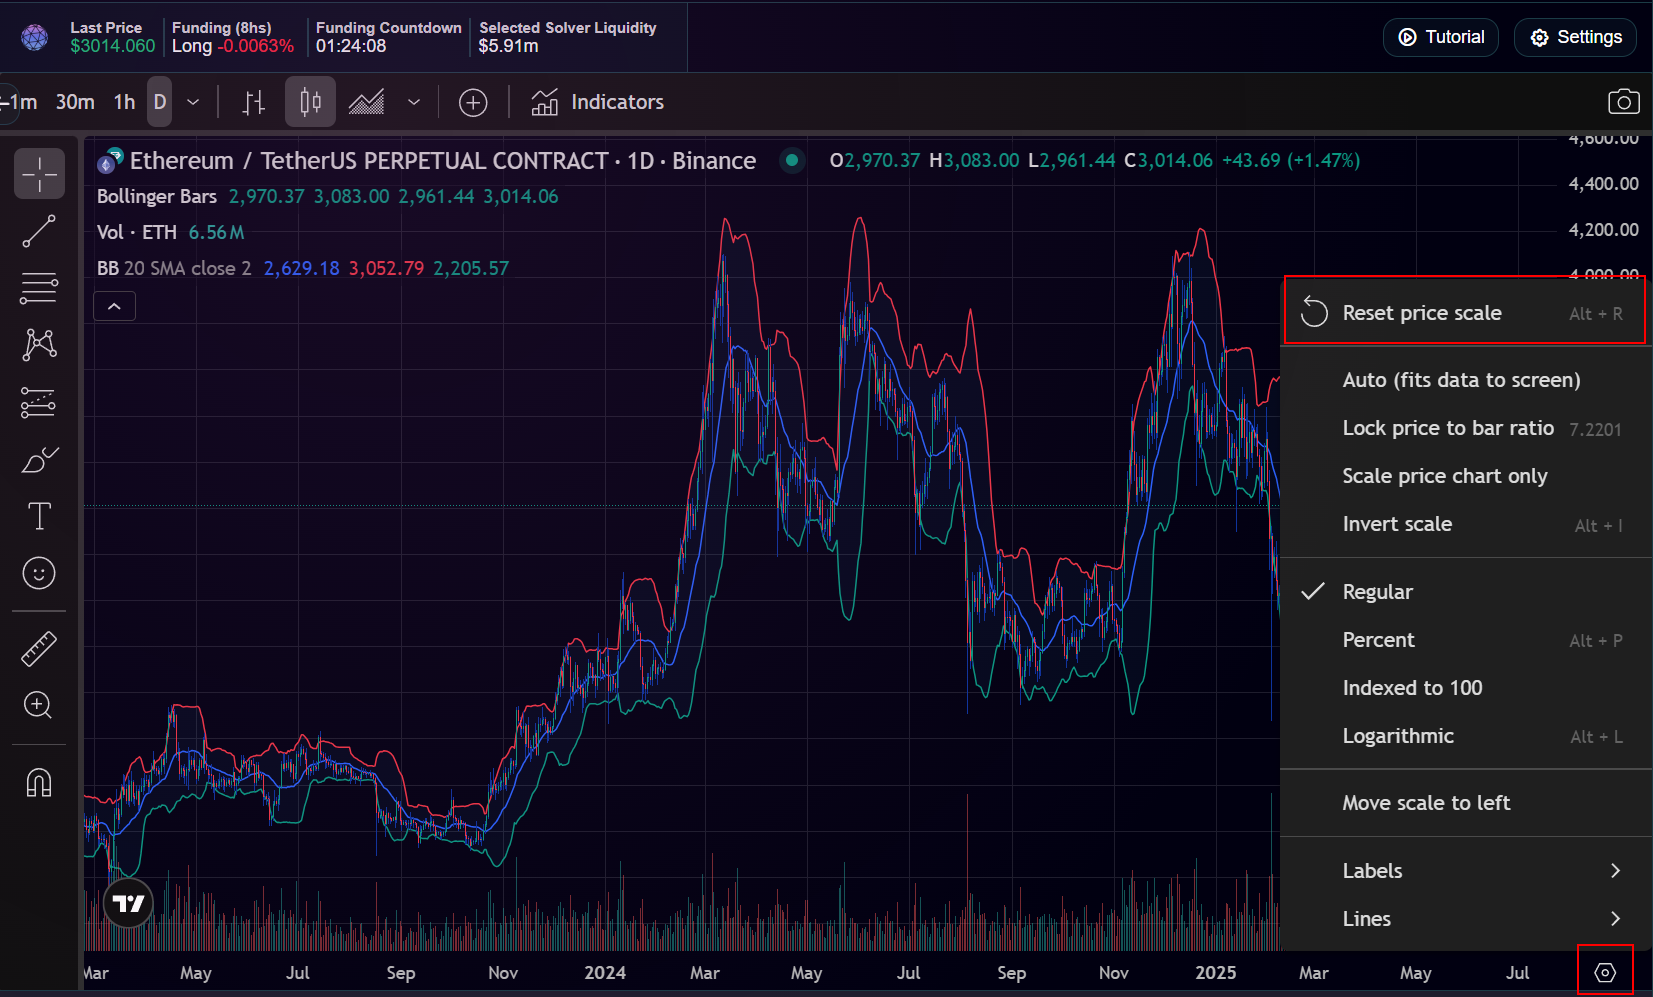
Delete indicators / reset scale
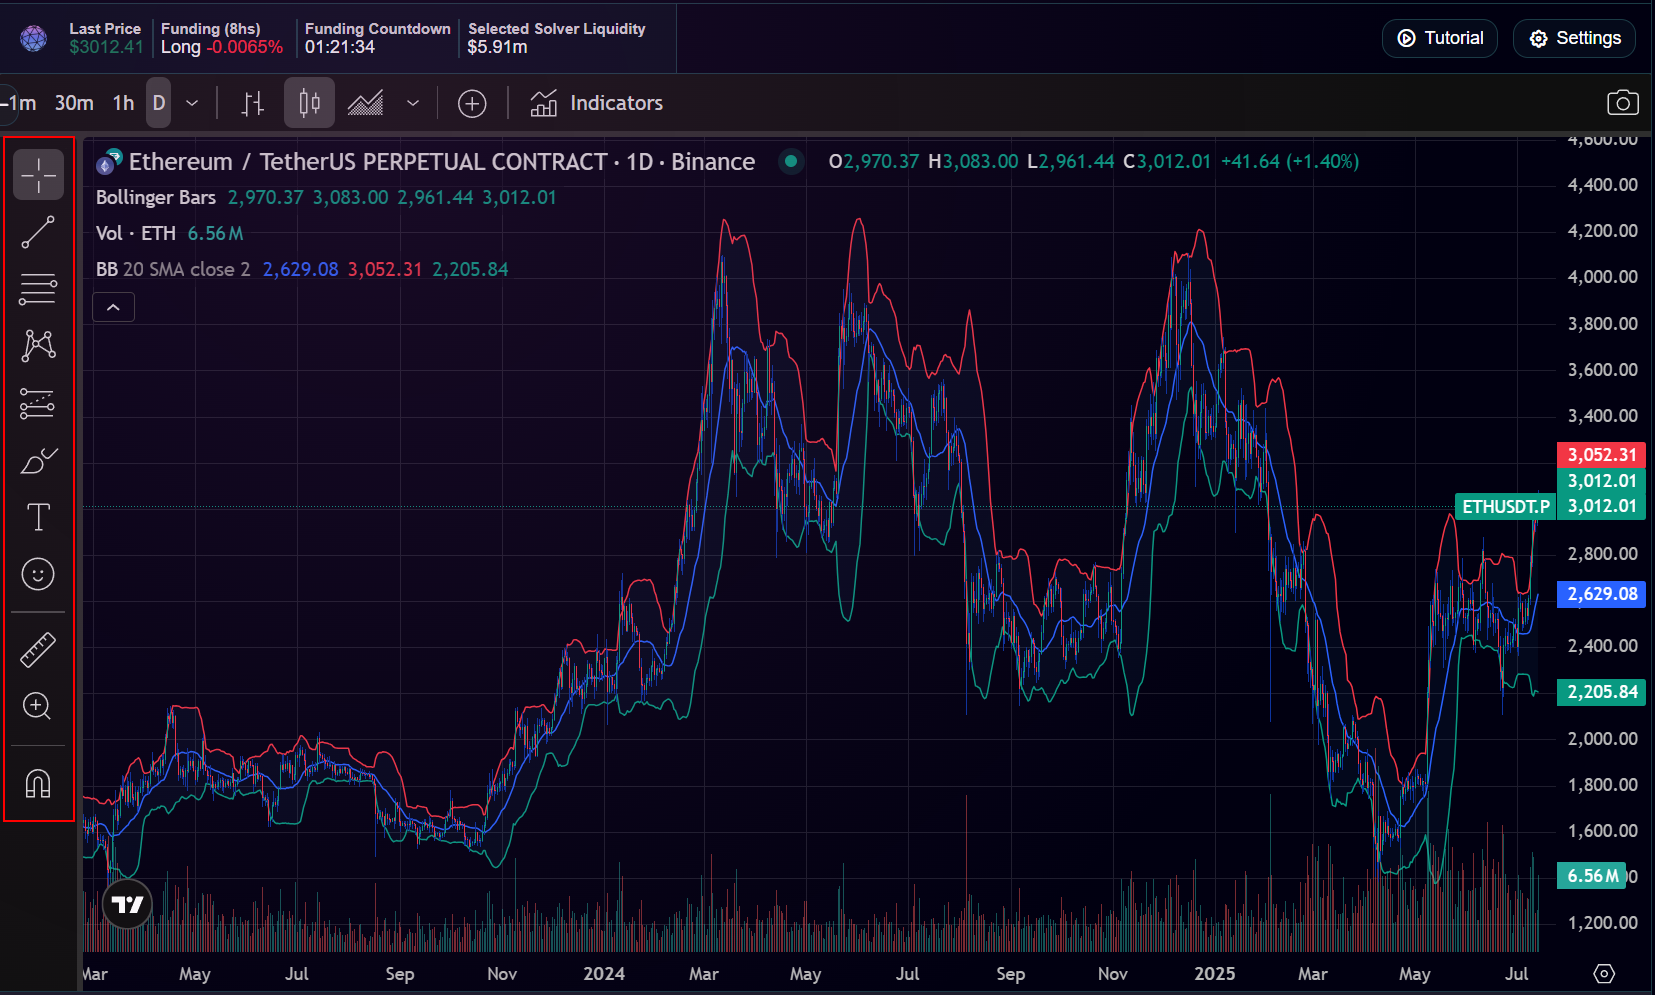
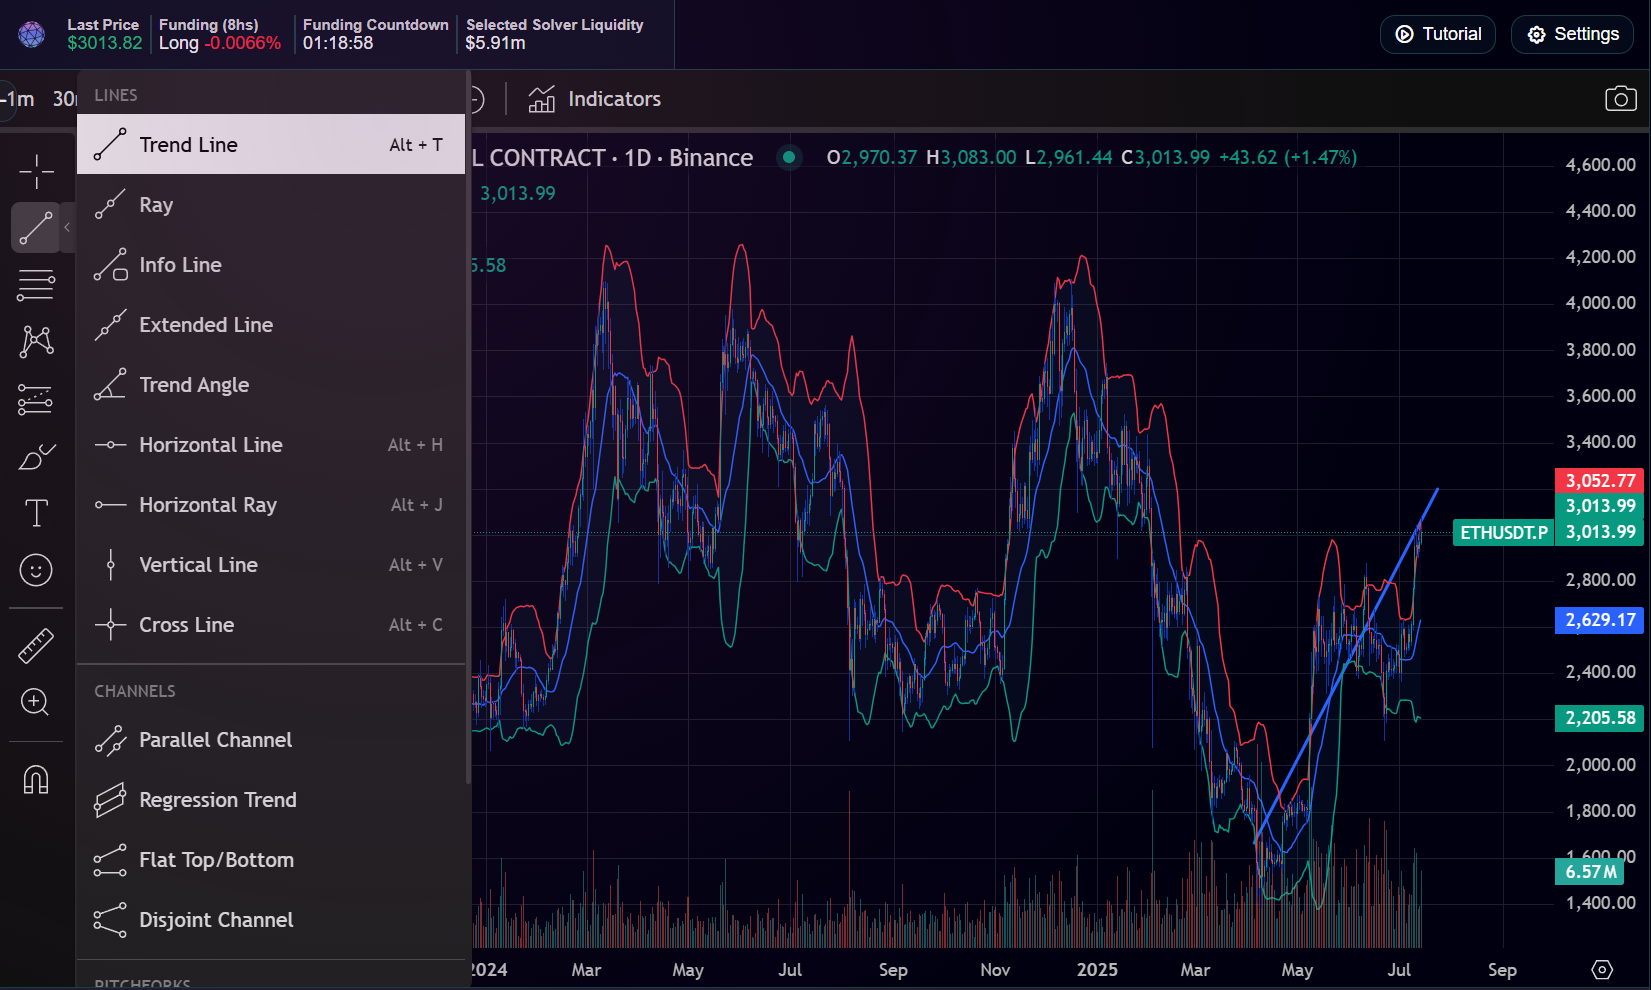
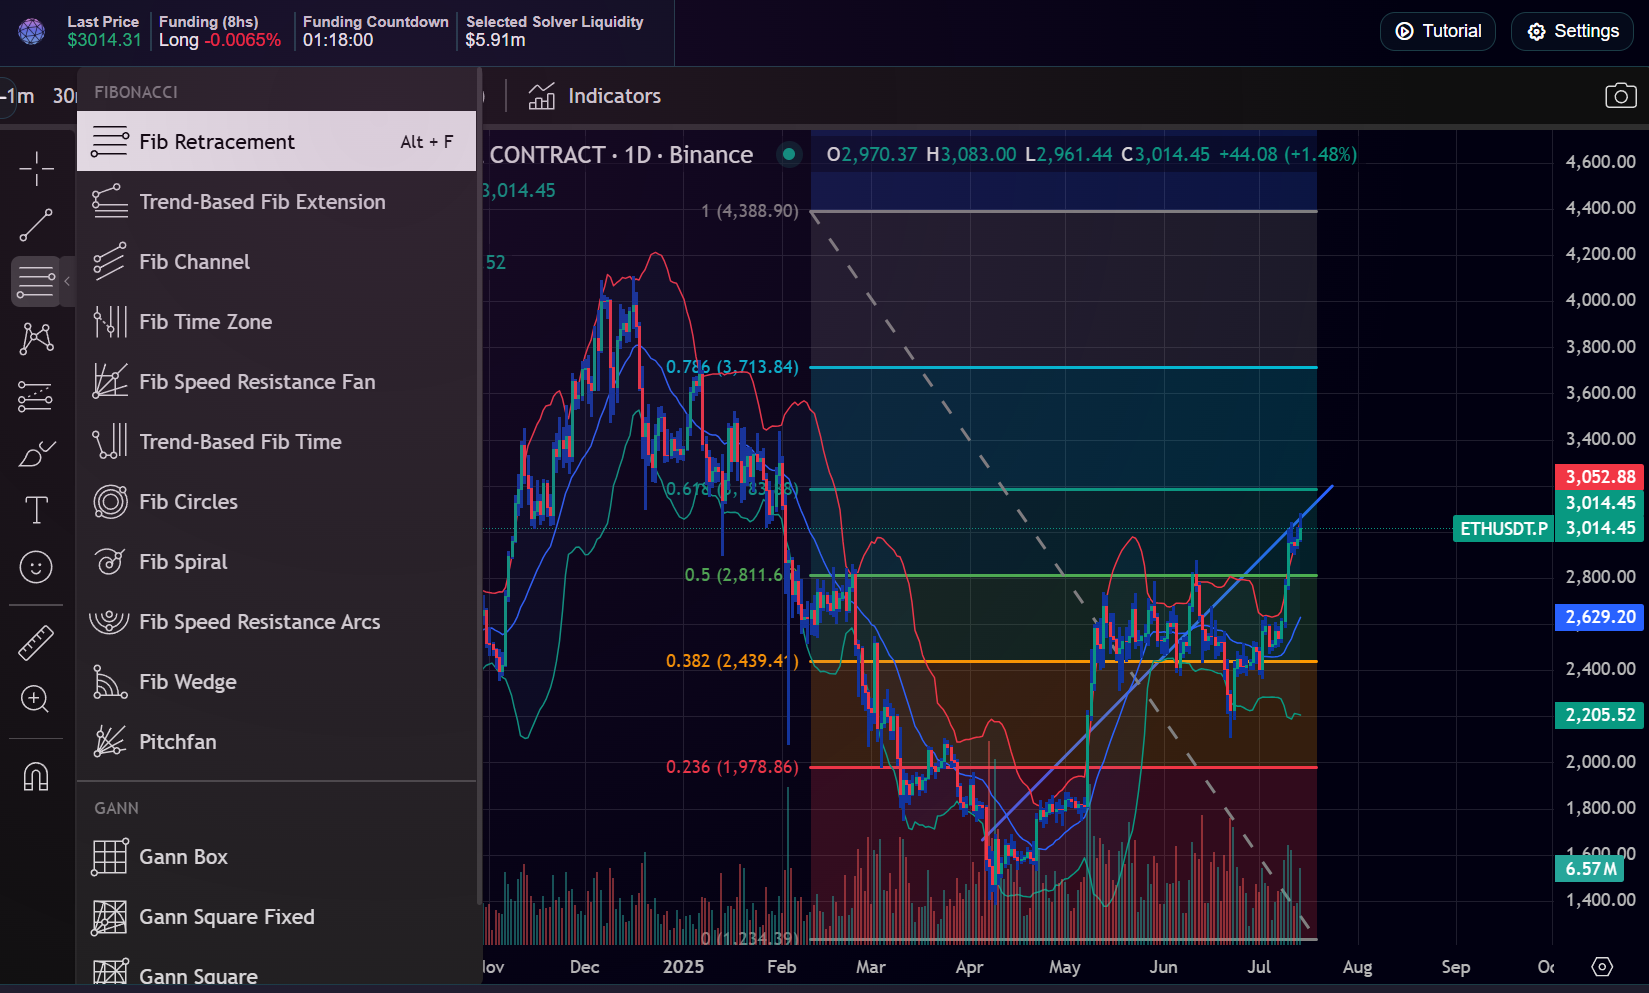
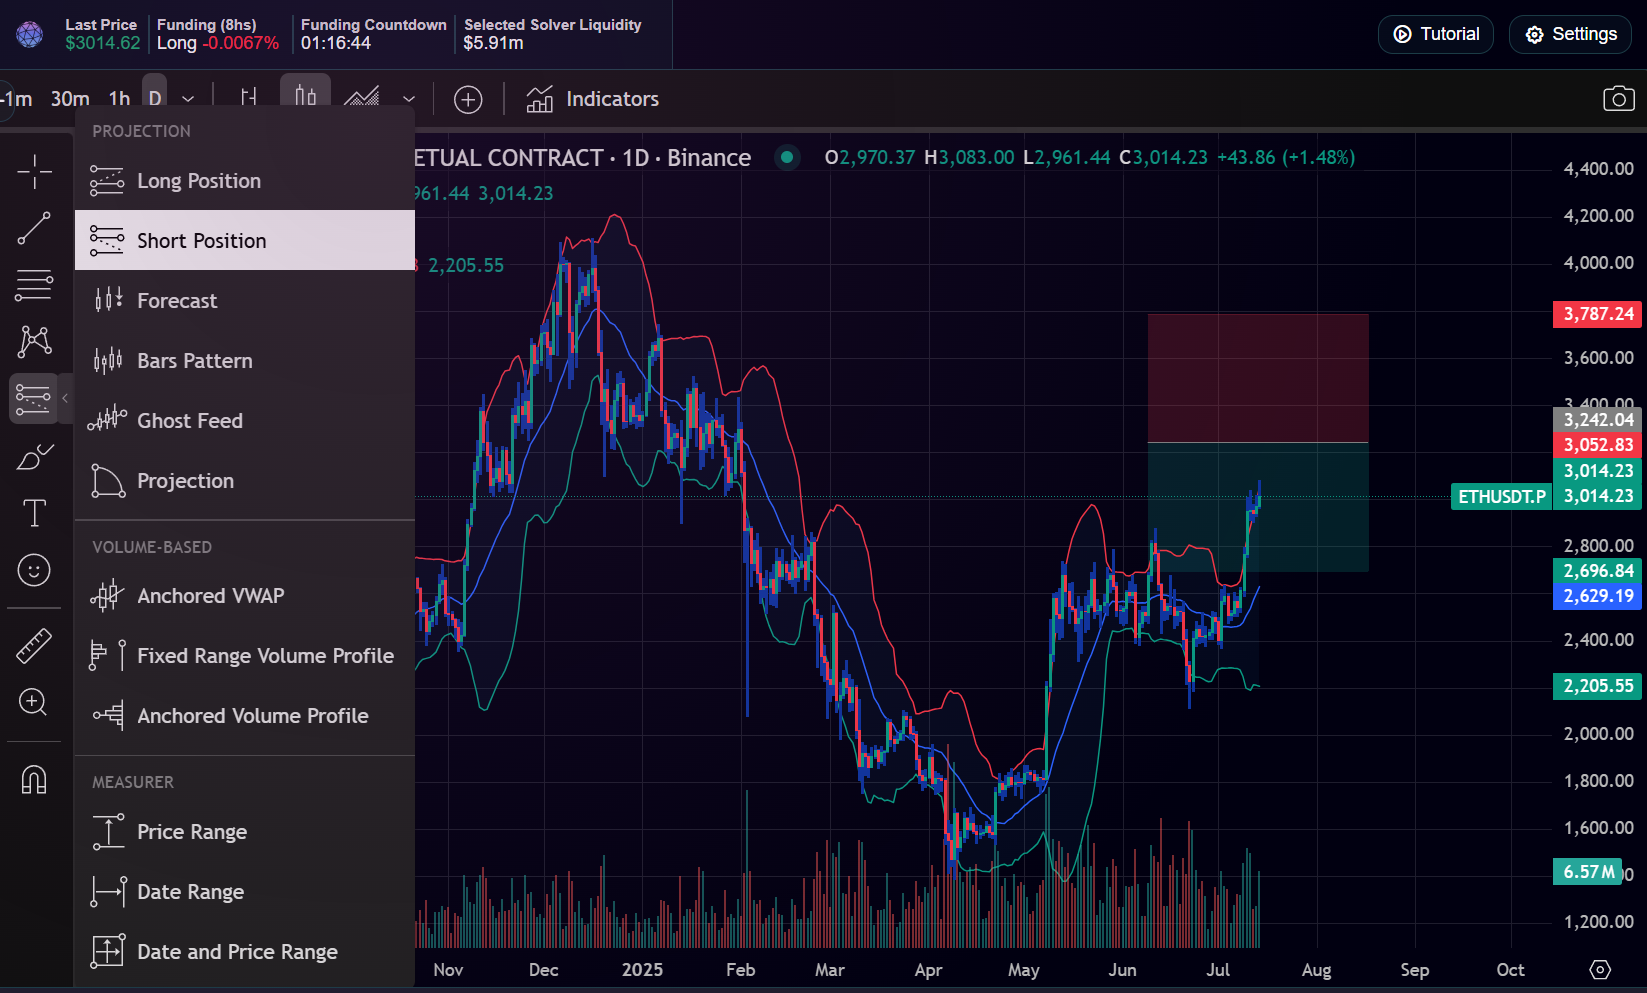
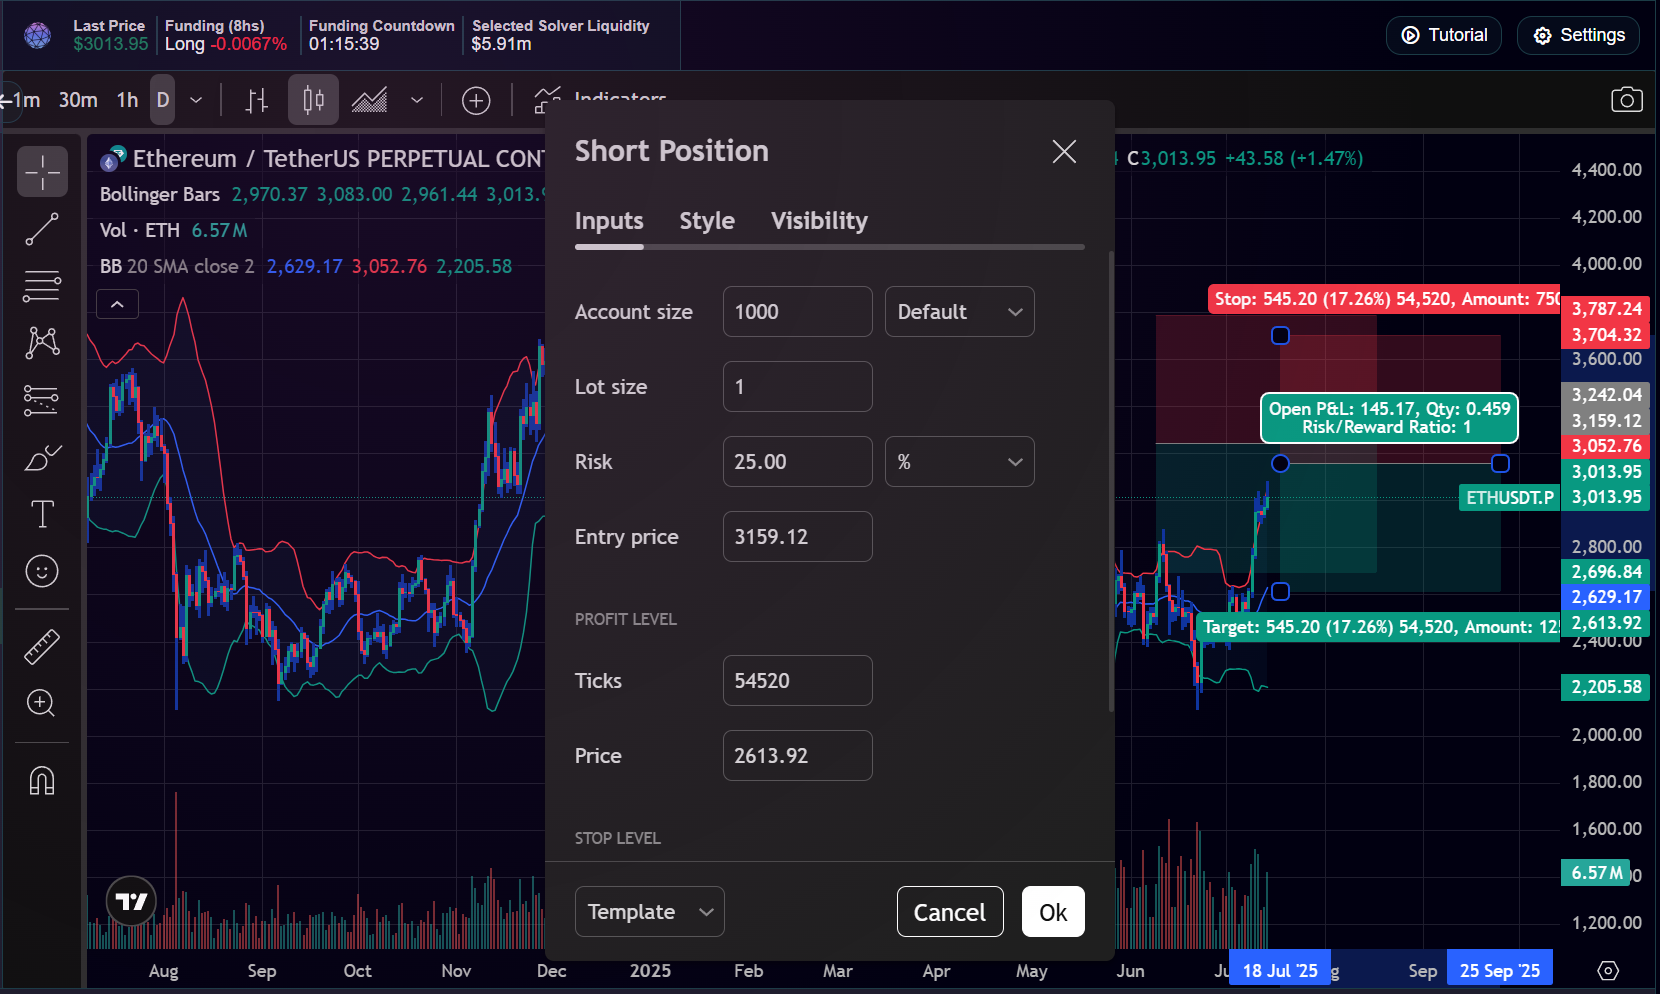
Drawing Tools
Left toolbar tools for lines, Fibonacci, forecasting, and measurement.
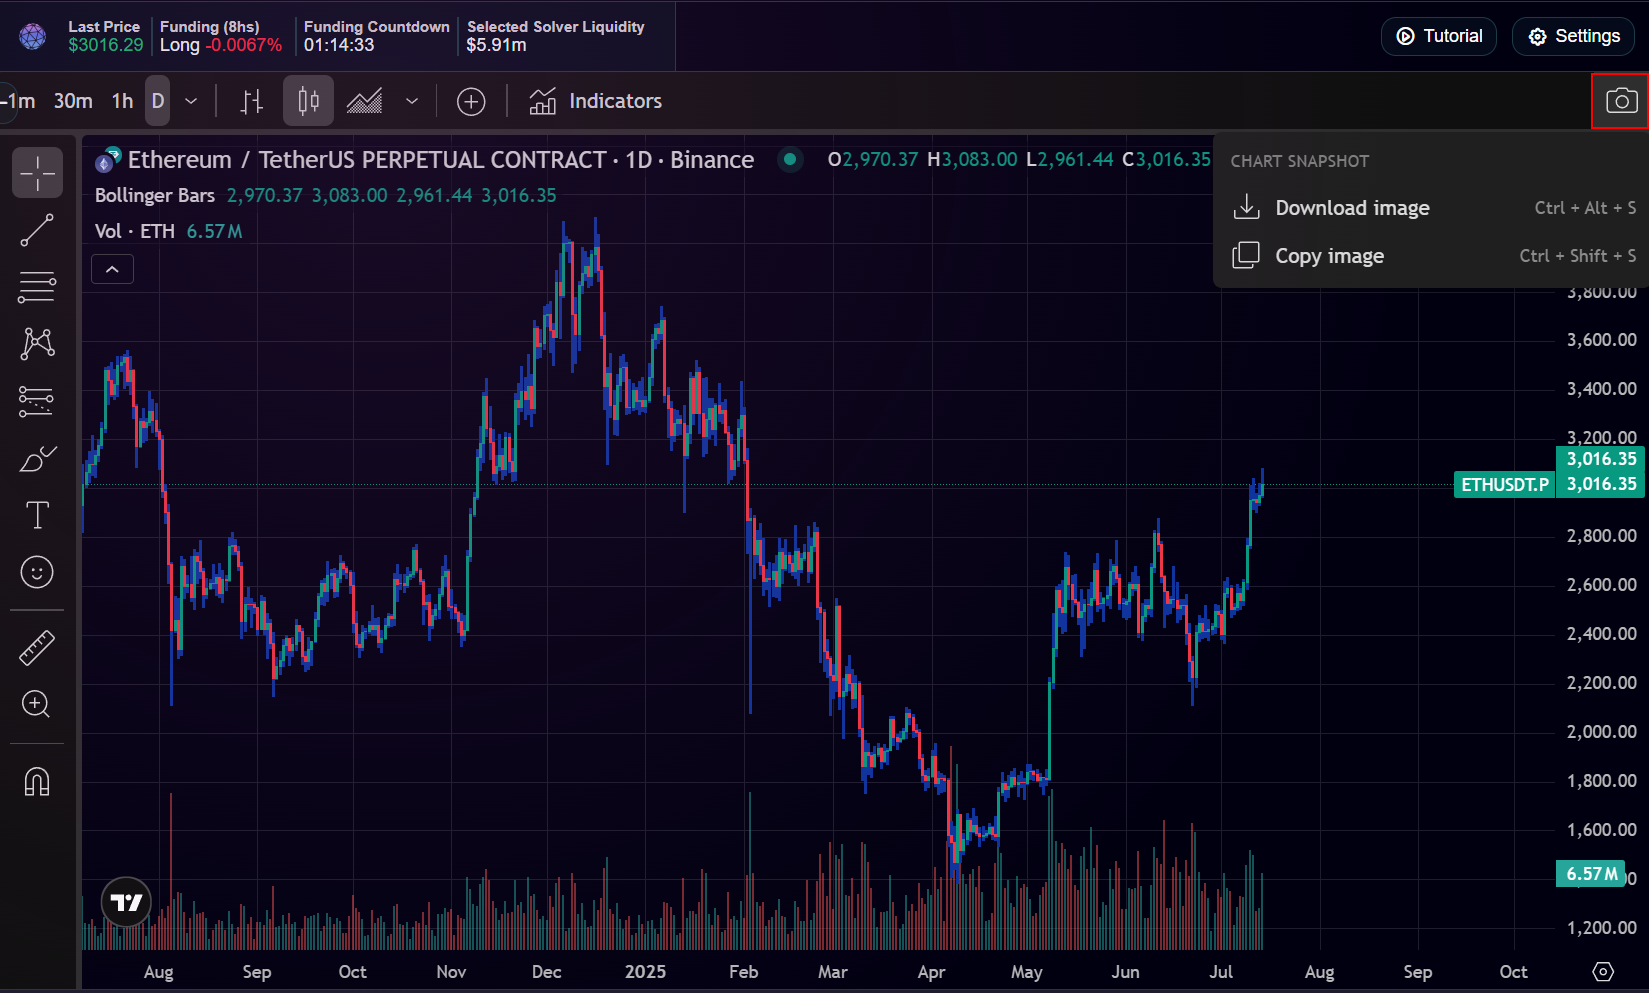
Take a snapshot
Use the camera icon in the top-right of the chart to download or copy an image.
For TradingView’s full guide, see their official docs.